Submitting Studies
The form for submitting or editing an existing Study is available at https://grassroots.tools/private/service/field_trial-submit_study.
A Study is an experiment that takes place at a location to measure a variety of phenotypes. It is one of the main forms that you will need to complete and has a number of fields:
- Load Study: If you wish to edit an existing Study, choose it from this list and its values will be loaded.
- Name *: The name of the Study.
- Field Trial *: This is the Field Trial that this Study belongs to. If the Field Trial that you require is not in this list, then you’ll need to create it by following the instructions for creating a Field Trial.
- Location *: This is the Location where the Study is taking place. If the Locations that you require is not in this list, then you’ll need to create it by following the instructions for creating a Location
- Sowing date: This is the date when the seeds are shown in the field.
- Harvest date: This is the date when the crops are harvested. The plots data can be entered at the drilling stage in which case this field can be left blank.
- Description: This is a free-text field where a general description of this Study can be defined.
- Growing Conditions: This is a free-text field where any notes about the growing conditions for this Study can be placed.
- Design: This is a free-text field where any notes about the experimental design of this Study can be set.
- Phenotype gathering notes: This is a free-text field where any notes about the collection of phenotypes for this Study can be set.
- Weather: If there is a system with the weather details for this Study, enter the web page for it here.
- Plan changes: This is a free-text field where any notes for changes to the Study field experiment plan.
- Data not included: This is a free-text field where any notes about data collected but not currently stored within Grassroots.
- Physical samples collected: This is a free-text field where any details about plant, soil or other samples collected.
- Crop: This is the crop that has been sown for this Study. If the required crop is missing, please contact us to make it available in the system.
- Previous crop: This is the crop that was previously sown in the field that this Study is in. If the required crop is missing, please contact us to make it available in the system.
- pH minimum: If the pH levels of the soil are known, enter the minimum value here.
- pH maximum: If the pH levels of the soil are known, enter the maximum value here.
- Soil: This is a free-text field to give any details about the soil condition for the Study
- Link: If there is a web page relating to this Study with more information that will be of interest to users, it can be specified here.
- Plots GPS: If you have a GeoJSON file with the layout of the plots within the field, you can submit it here. To map the plots defined in this Study to the shapes in this file, we have a value called plot_id which is set to the id of the relevant plot. For instance the following snippet has the shape details for plot_id of 60 which refers to the plot with Plot ID of 60 in the table uploaded when submitting plots.
{
    "type": "Feature",
    "properties": {
        "Id": 0,
        "plot_id": 60,
        "BUFF_DIST": -0.2,
        "ORIG_FID": 5
    },
    "geometry": {
        "type": "MultiPolygon",
        "coordinates": [
            [
                [
                    [-0.396041480123381, 51.803951709489667],
                    [-0.396060782373093, 51.803947819495299],
                    [-0.396099327120226, 51.804021327278761],
                    [-0.396080024842019, 51.804025217279019],
                    [-0.396041480123381, 51.803951709489667]
                ]
            ]
        ]
    }
}
Layout
- Aspect: The direction of the plots layout. If this is not known, choose Unknown.
- Slope: The slope of the field.
The next set of values take into account the gaps between plots within the field as well as the routes to allow tractors to navigate the field and perform the drilling. In the next list of parameters, these groups of plots between the tractor tracks are referred to as a block
- Horizontal plot gap: This is the distance, in metres, between each plot within a row.
- Vertical plot gap: This is the distance, in metres, between each plot within a column.
- Plot rows per block: If the layout has spaces to allow for tractors, this is how many rows of plots there are in each of blocks between the tractor routes.
- Plot columns per block: If the layout has spaces to allow for tractors, this is how many columns of plots there are in each of blocks between the tractor routes.
- Horizontal plot block gap: This is the distance, in metres, between each block of plots within a row.
- Vertical plot block gap: This is the distance, in metres, between each block of plots within a column.
Default plot data
To make the plots data easier to enter if you have a standard layout, you can set some default parameters here and Grassroots will automatically create a partially-completed spreadsheet for plots data for this Study. The values that can be set are:
- Number of plot rows: How many rows of plots there are in this Study.
- Number of plot columns: How many columns of plots there are in this Study.
- Number of replicates: The number of genotype replicates in this Study. If left blank, it is assumed to be 1.
- Plot width: This is the width, in metres, of each plot.
- Plot length: This is the length, in metres, of each plot.
To automatically generate the spreadsheet of Plot data, at least both of the Number of plot rows and Number of plot columns parameters need to be specified. Grassroots will generate a row in the spreadsheet for each unique possible combination of the row, column and replicate values.
Treatment Factors
You can specify Treatment Factors that are used in this Study so that they can be added to the Plots spreadsheet data. To begin with find the Treatments that you want to use in this Study by using the Search Treatments service and put the unique name of the Treatment, it will likely begin with PECO:, into the Treatment name box. Next you can define the Treatment Factor values that you wish to use in the Treatment Factors to upload field. This is a table with two columns:
- Label: This is value that will be put into each row of the spreadsheet in the column that has the unique name of the Treatment as its heading.
- Value: This is the actual value or range of values that the label refers to.
For example, we could choose PECO:0007102, which is the ontology term defining nitrogen fertilizer exposure, as the Treatment that we are interested in. Then, in its table of values, we could have
| Label | Value |
|---|---|
| N1 | 0-20 mg/L |
| N2 | 21-50 mg/L |
| N3 | 51+ mg/L |
So when submitting Plots, you can have a column in the spreadsheet with PECO:0007102 as the header and either N1, N2 or N3 as the values for each Plot entry row.
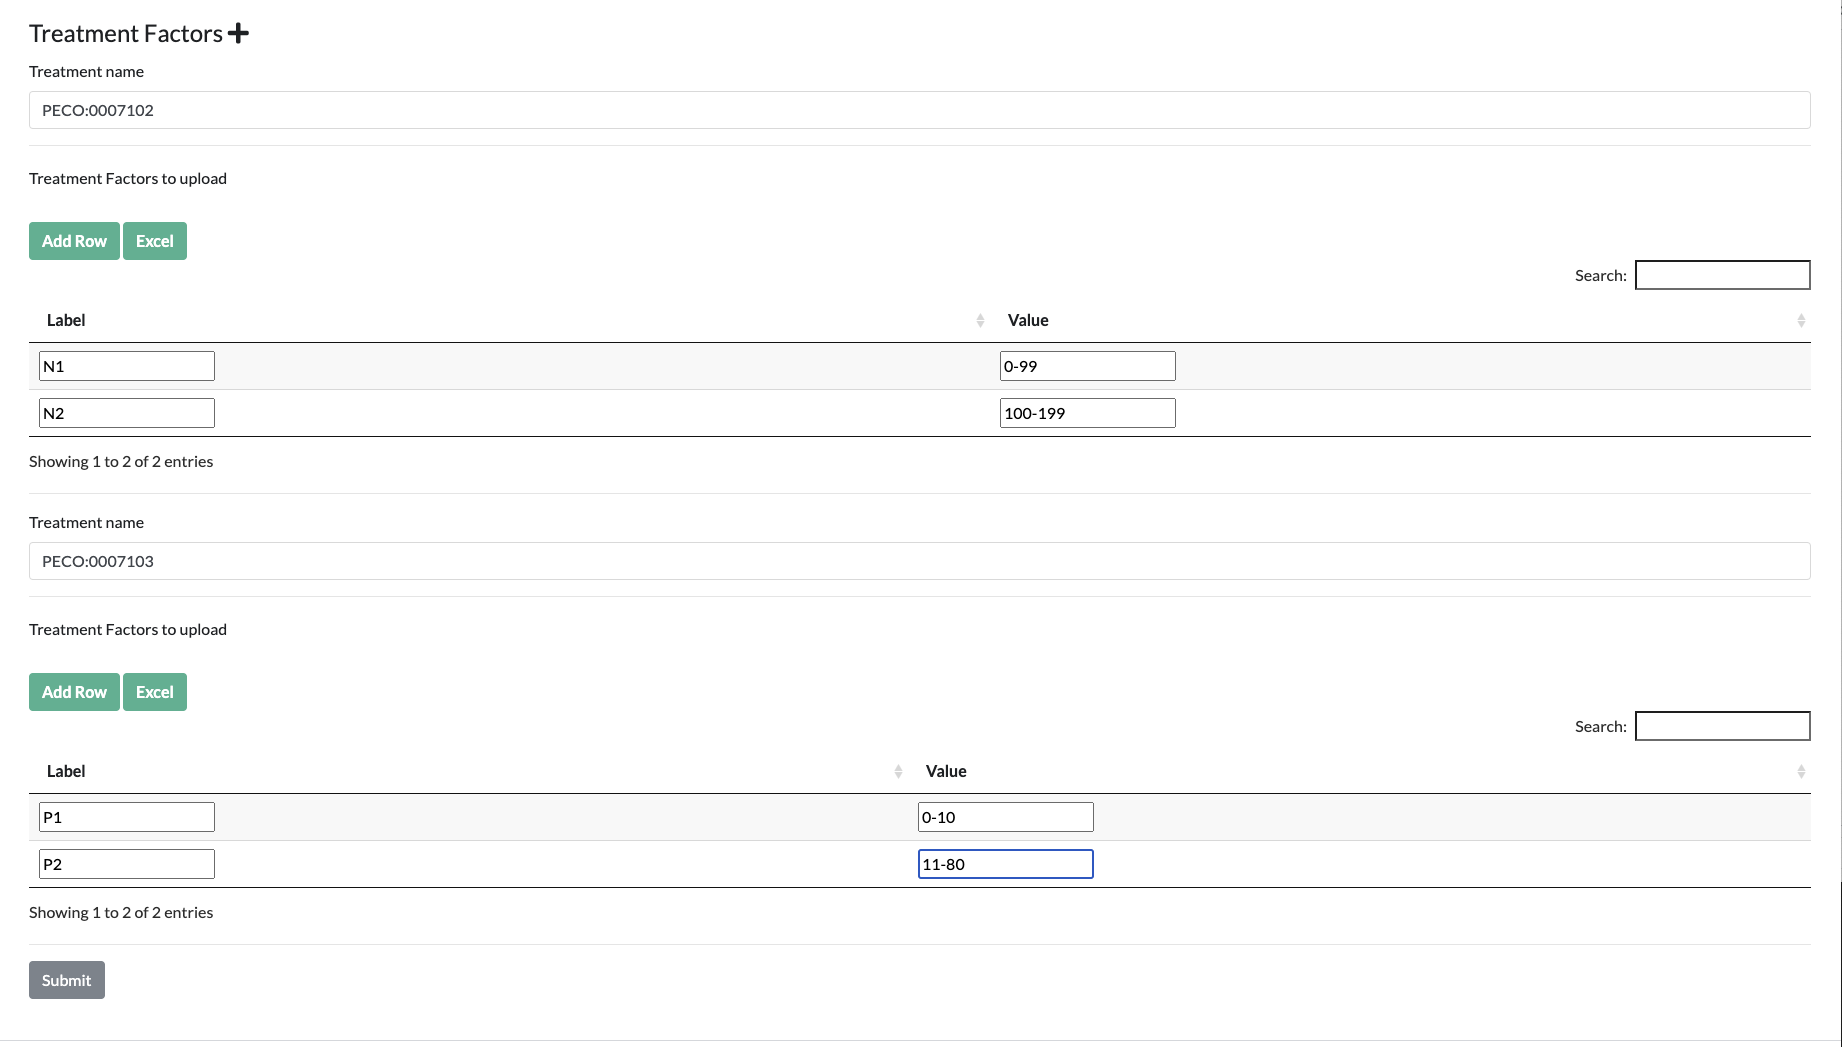
Press the + button to add a new set of treatment factors, and under each of them press Add Row to add new Labels and Values.
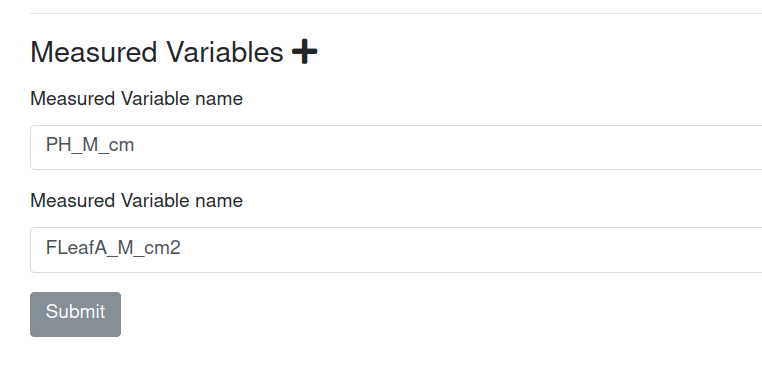
Measured Variables
These are the variables (phenotypes) that are measured in the study. They are usually detected and added when a spreadsheet with the plot observations and layout of the plots is uploaded in the submit plots service. However, the observation variables can be also defined when the study is created or edited. To add a new variable, press the + button and then enter the name of the phenotype name. You add as many variables as needed.
All the names of the measured variables can be searched and verified in the search measured phenotype service. See the Measured Phenotype Service documentation for more information.
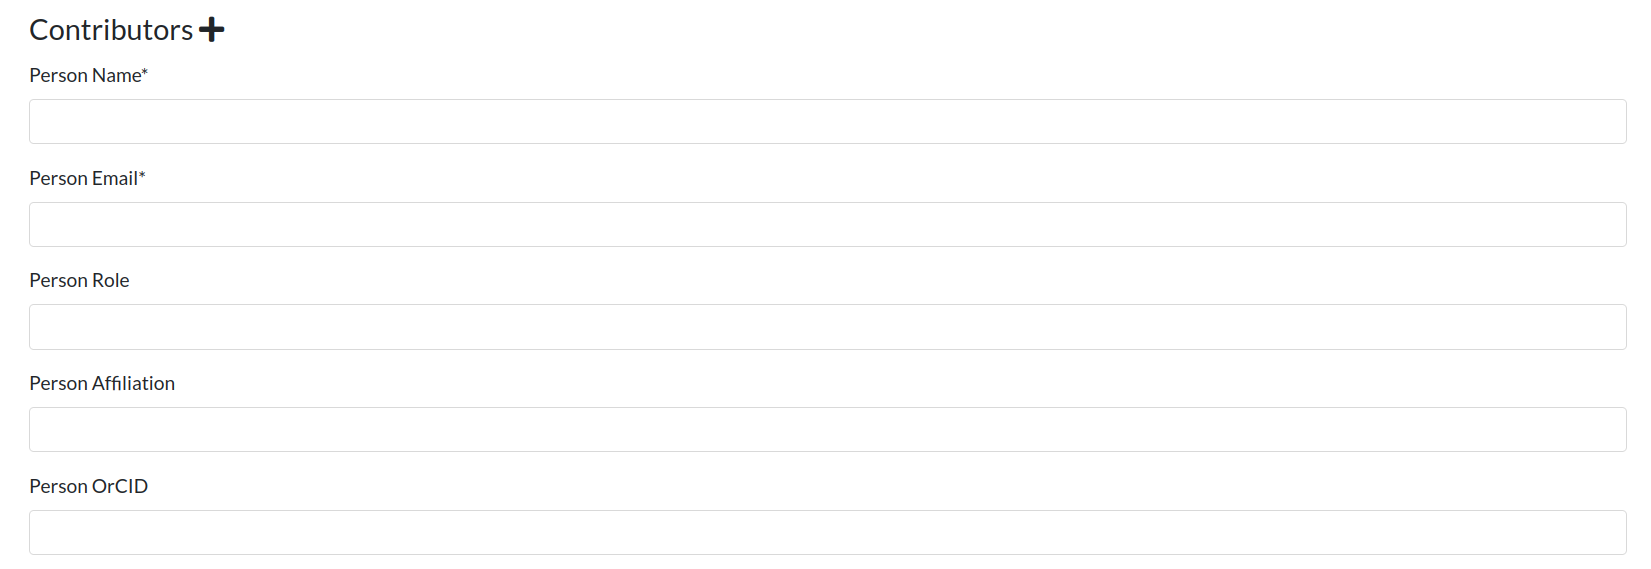
Contributors
If more people are involved in a particular study, it is possible to acknowledge them by adding them as contributors. It is possible to add as many contributors as needed. To add extra contributors, press the + button and then enter their name and email address. optionally, you can also add role, affiliation and ORCID.