Mobile App for Grassroots Field Trials
Introduction
The mobile app displays and submits the observations in field trials. It is written in Flutter and will available for both Android and iOS. The current version is a prototype and is only available for Android.
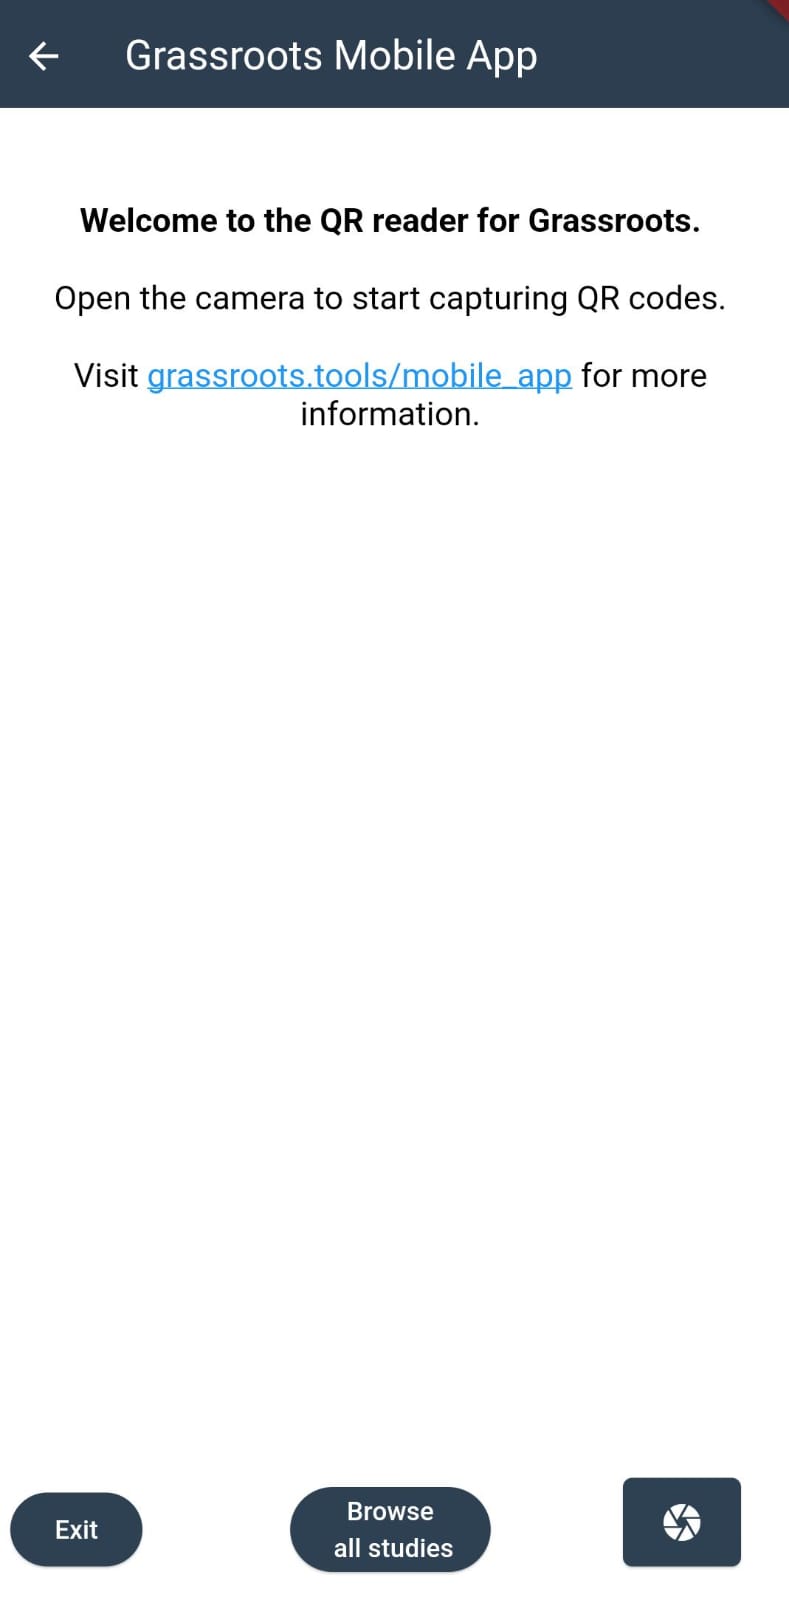
The app scans QR codes which identify individual plots within a field trial study. It then displays the details of the plot on the screen. The user has the option to enter new observations for the plot and submit them to the Grassroots Field Trial system.
The app can be downloaded from the Google Play Store.
Whilst it is still in prototyping, there will be only be one simple study with QR codes available.
Getting Started
On the the home screen the user can select a study by clicking on the study name from a dropdown menu.
Once a study is selected, the app will display a menu for selecting any plot by its plot index. If the plot has any recorded observations, the total number of observations in that plot will be displayed. The user can then select a phenotype to open a table that shows all of the plot's observations. The table shows the phenotype, date and any additional notes.
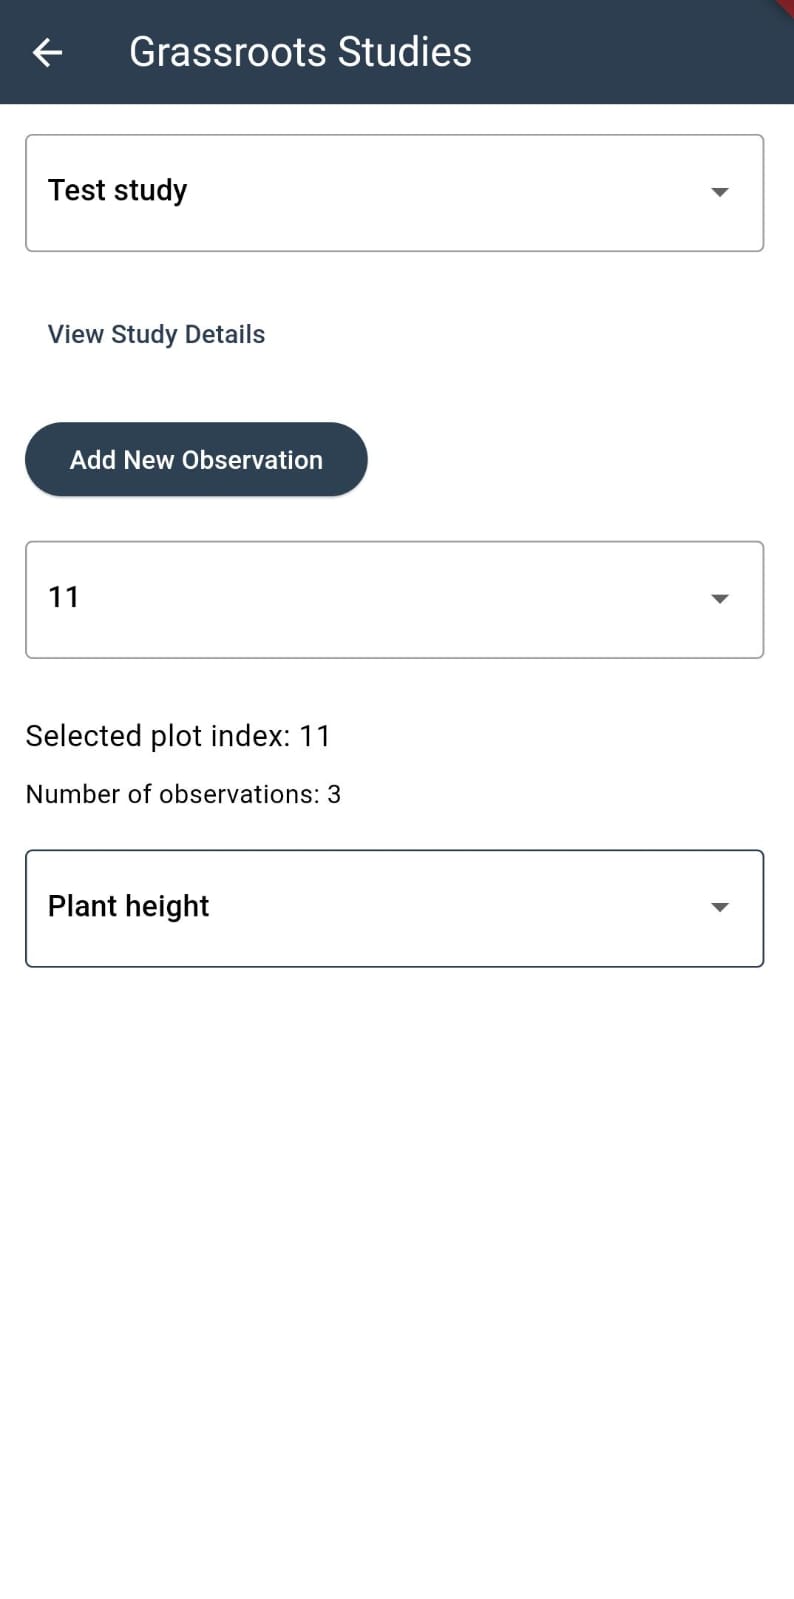
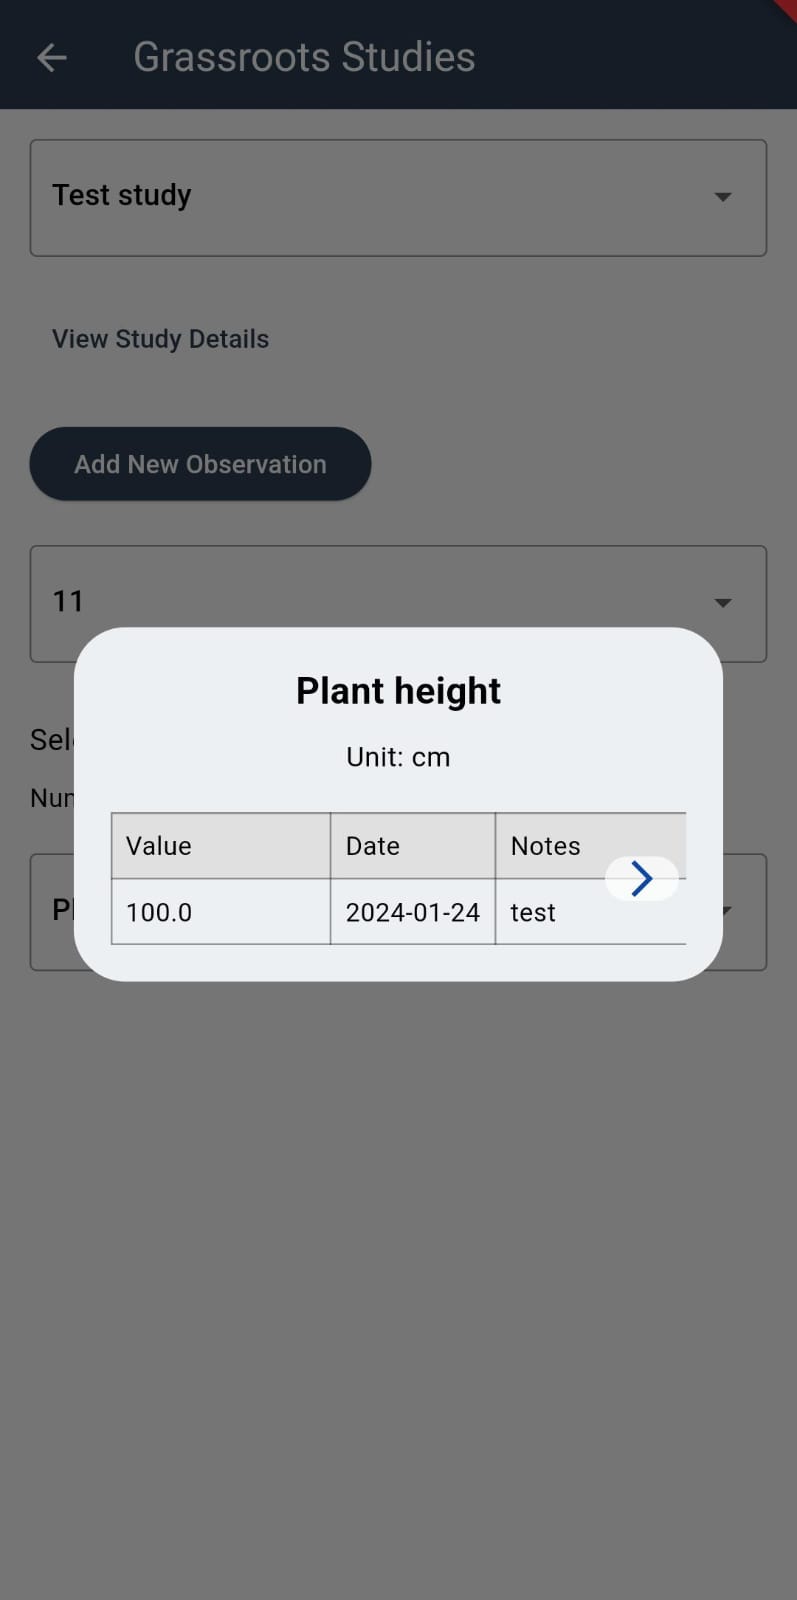
The general details from the study can be displayed by clicking on the View Study Details button.
Submitting Observations
Once a plot is selected, the user can submit new observations by clicking on the Add New Observation button. The app will display a form where the user can enter the details of a new observation. First, the user selects the phenotype from the dropdown menu. The unit of selected phenotype will be displayed next to the field where the actual observation value will be entered.
The current date is automatically added to the form although it can be changed by the user. The user also has the option to add additional notes to the observation.
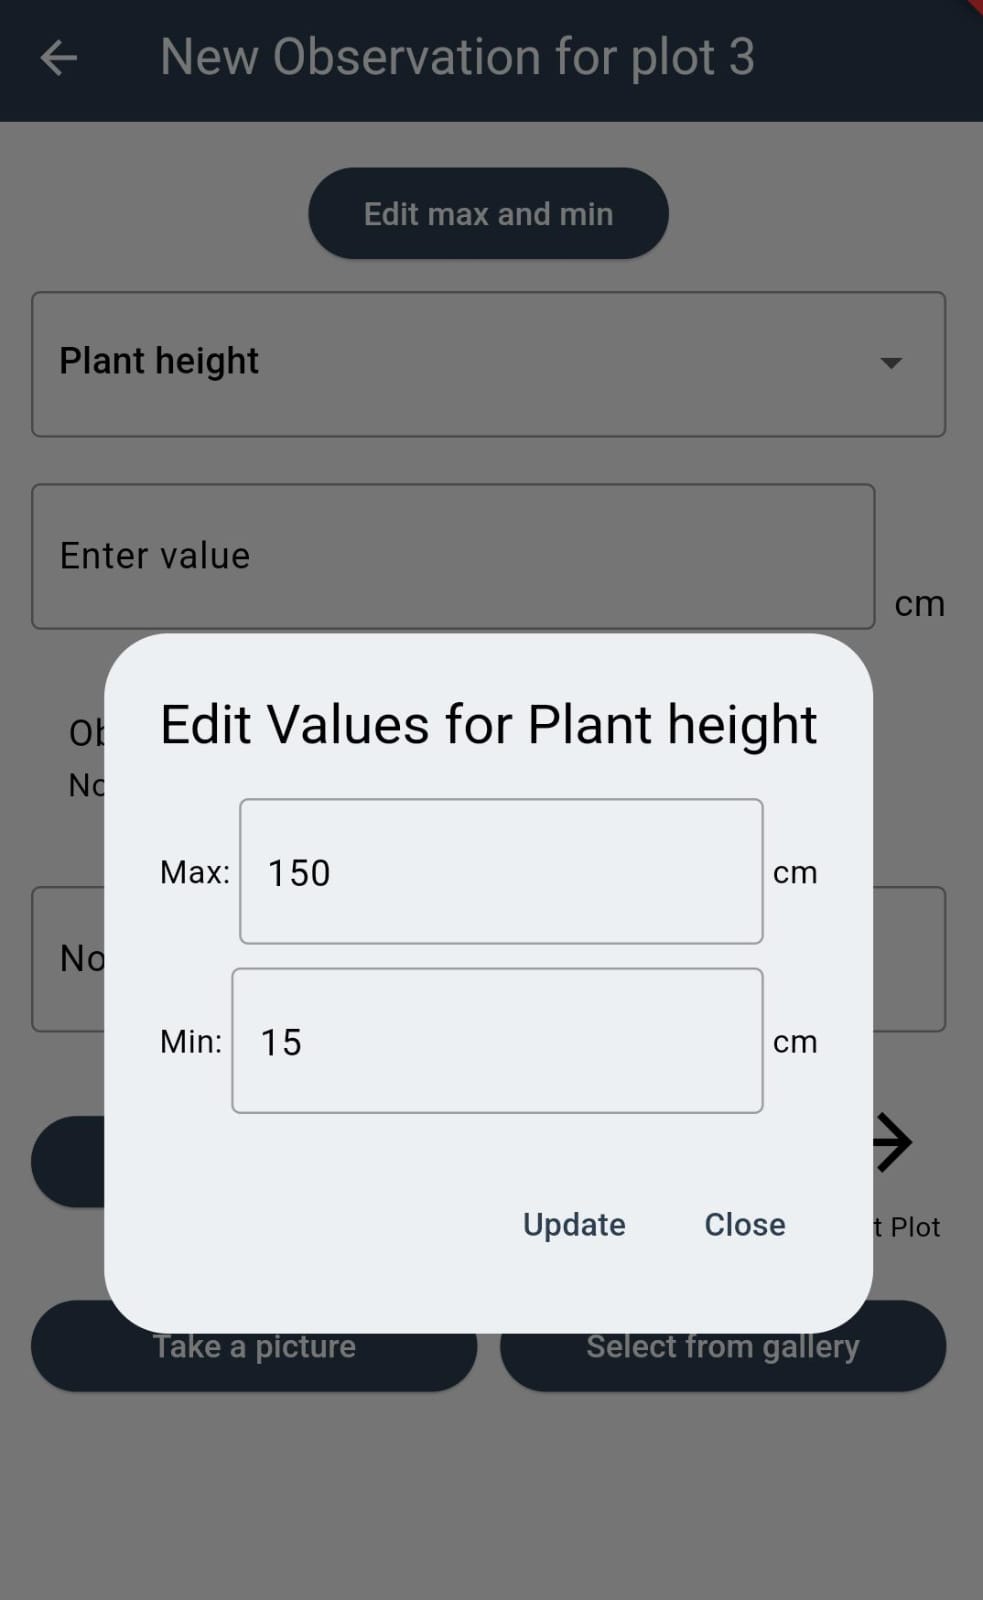
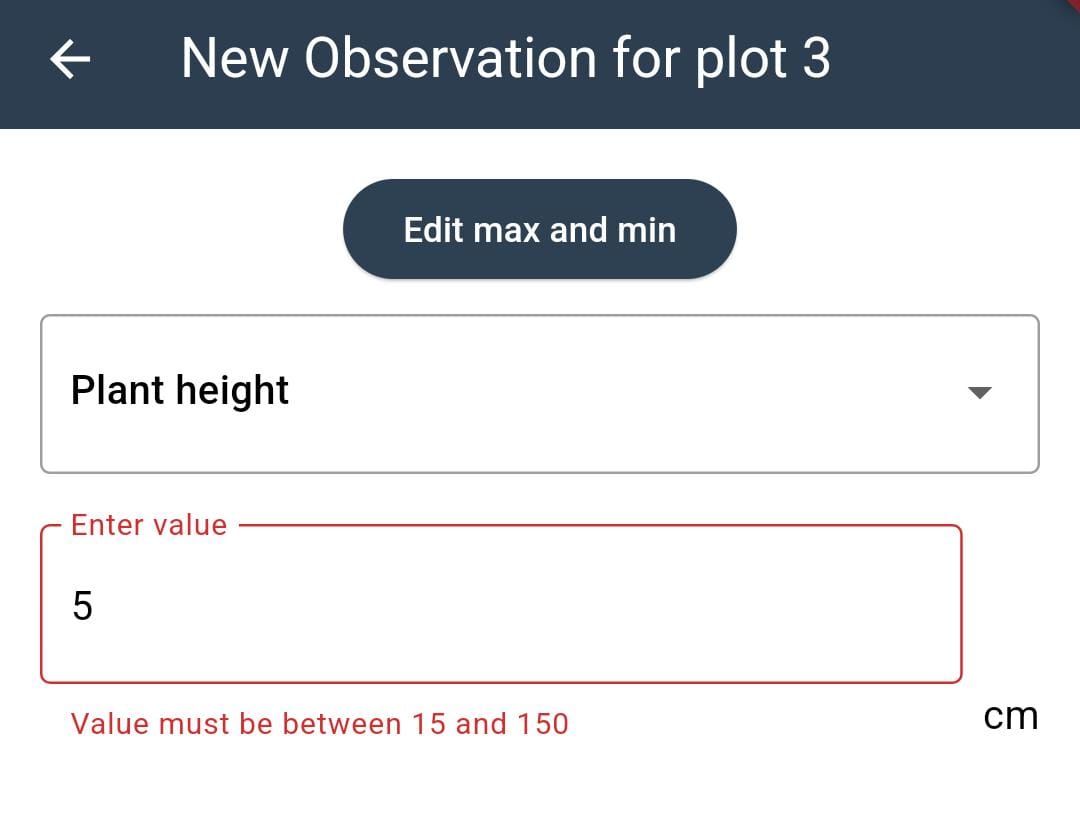
There is only one validation in place at the moment which is for the plant height (cropontology.org/term/CO_321:0000020). When the plant height is selected, a form to enter or edit the minimum and maximum values will be displayed which the user can adjust and click on Update to save the new minimum and maximum values or Close to cancel. Then if the user enters an observation value that is outside this range, the observation will not be submitted and an error message will be displayed.
Once an observation is submitted, the form will be cleared and the user can enter another observation or move to the next plot by clicking on the Move to Next Plot button.
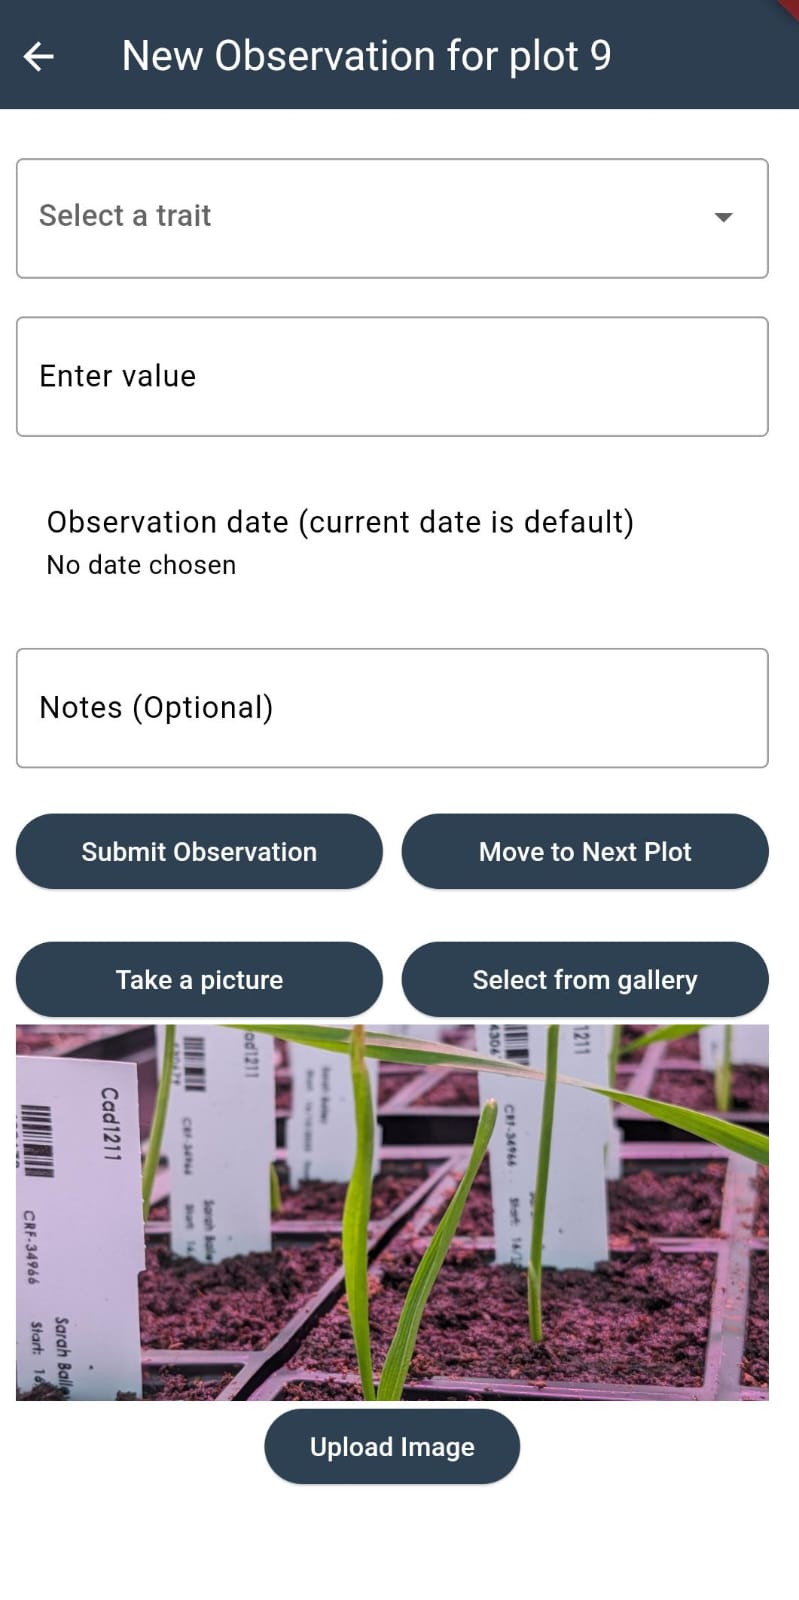
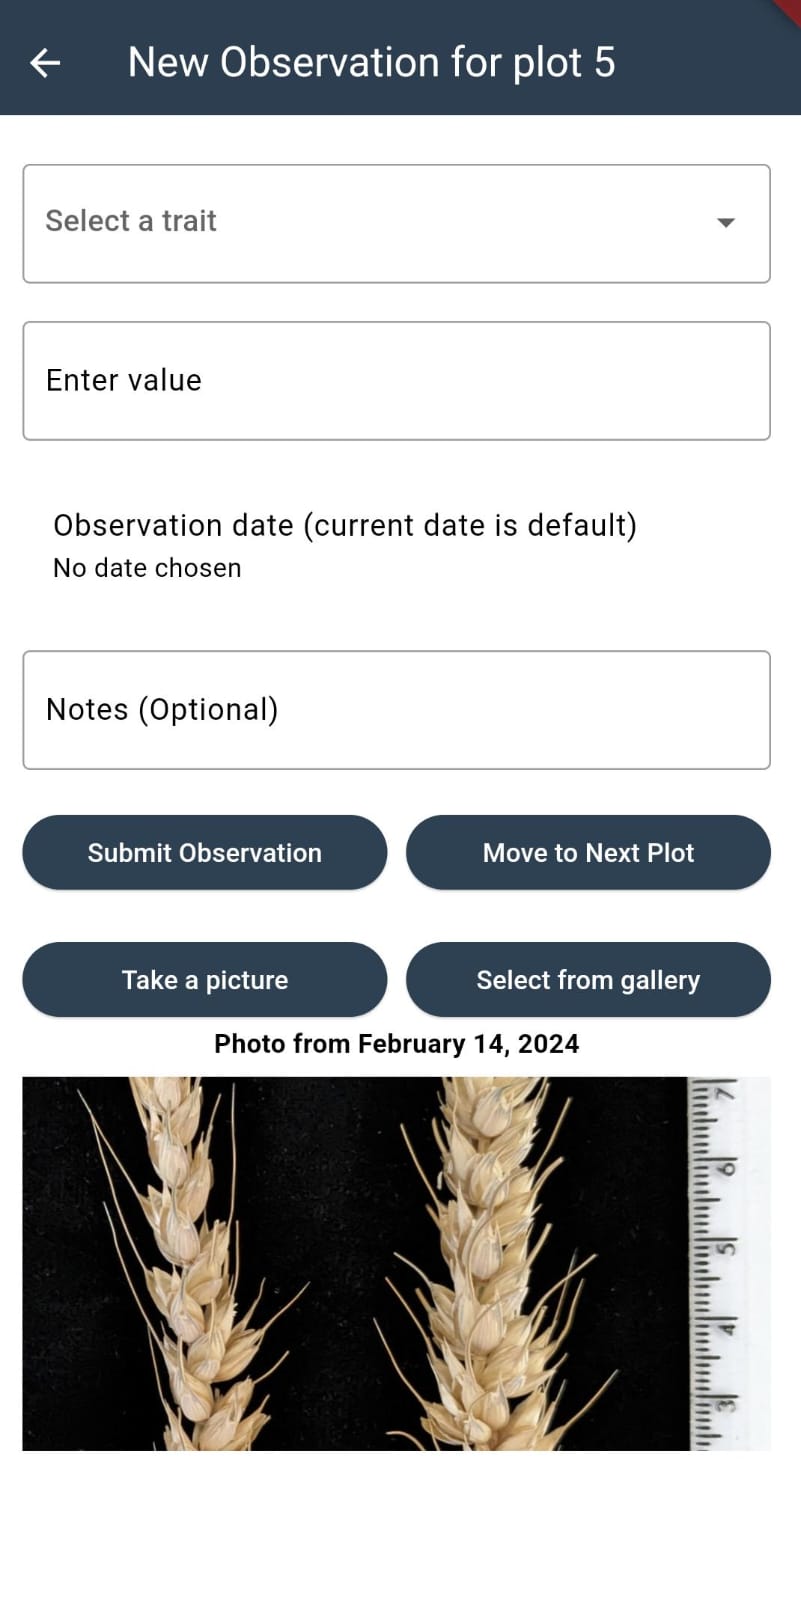
Attaching images to observations
The user can also take a photo and attach it to the selected plot. The photo can be taken by clicking on the Take a picture button or selected from the gallery by clicking on the Select from Gallery button. The photo will be displayed in the form and, if the user wants to use it, the photo can be submitted by clicking on the Upload Image button. If a plot already has a photo attached, the photo will be retrieved from the server and displayed in the form with the date it was taken. A new photo can be taken and it will be added along with the date it was taken. Clicking on any of the photos will display them in full size.